Pipeline
Imaging: stacks, sections and cultures
ROI Analysis measures regions or a line over time in a stack of coregistered frames, such as two-photon calcium or blood-flow imaging. Histology / culture counts cells and marker-positive cells in still images of sections or cultures.
Methods
Using a ROI (one trace per ROI)
- Brightness: mean intensity in the ROI per frame. Movement: mean absolute frame-to-frame difference in the ROI. Both: the two on two axes.
- ΔF/F: (F − F0) / F0 of the ROI intensity, F0 = mean of the first N frames (default 30). ΔF/F is the usual measure for calcium indicators[10].
- Blood-flow speed is not measured from a ROI. The former “Speed (flow)” method computed the mean absolute frame-to-frame difference, the same as Movement, and was removed. Red-blood-cell streaks can be seen in the kymograph of a line along a vessel.
Using a line
- Kymograph: intensity along the line in every frame, as a position × time image. Along a vessel, slanted streaks come from moving blood cells and their slope is their speed, the idea behind line-scan velocity measurements[9].
- Vessel diameter: width at half level (FWHM, pixels) of the profile along a line drawn across the vessel, with walls located to sub-pixel precision. Robust diameter uses running-median background and lumen levels and a Hampel filter[45, 46] (7 frames, 3 robust SD) so that a blood cell crossing the line does not make the width jump.
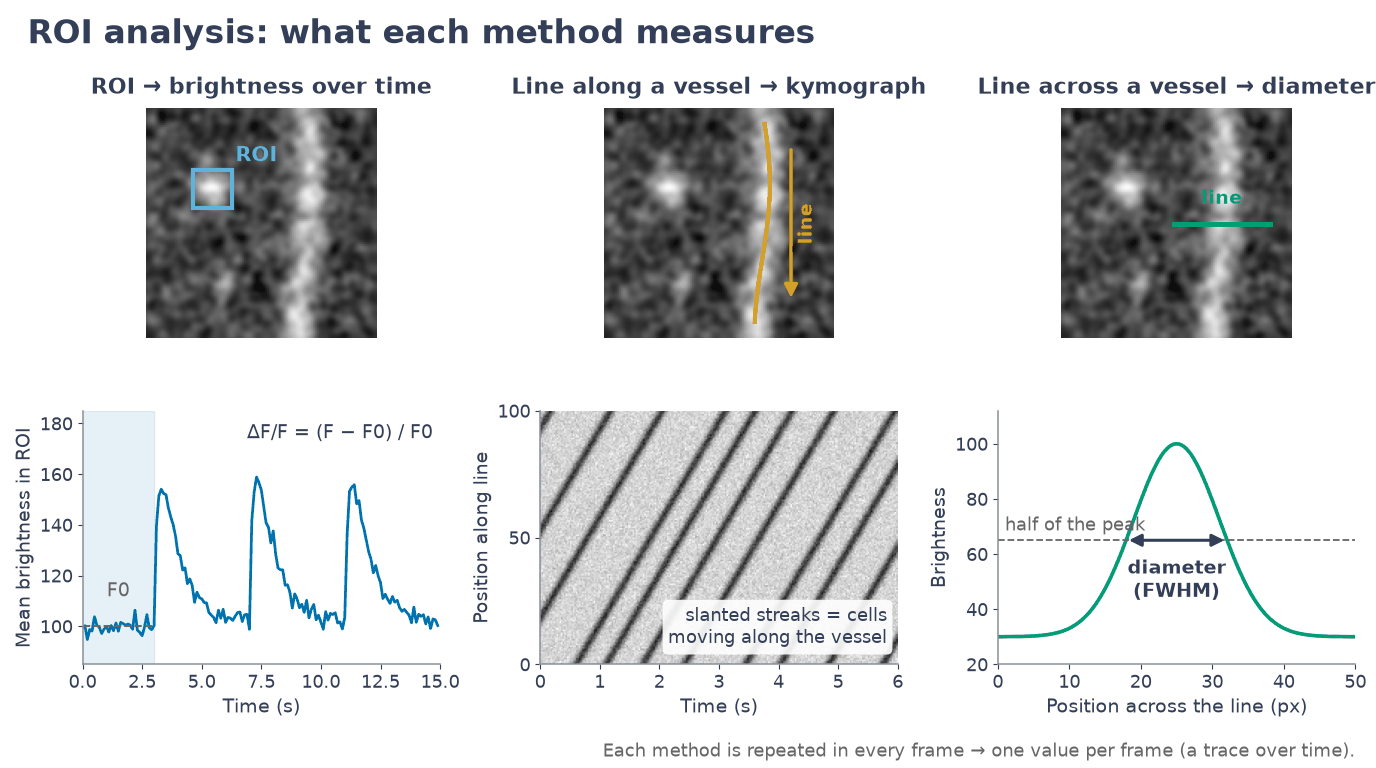 Illustration
Preprocessing and tools
- Motion correction (rigid): every frame is aligned to the mean image by FFT phase correlation[44] with a sub-pixel peak fit (two passes) and shifted back (bilinear). Translation only.
- Detect cells: local correlation image (mean correlation of each pixel with its 8 neighbours; the idea of comparing each pixel with its 8 neighbours to find cells is from Smith and Häusser[47], who used the peak cross-correlation, while the toolbox uses the plain correlation), an automatic threshold (median + 4 robust SD, at least 0.2), connected components of 20–1000 px that are not elongated, holes filled; cells numbered left to right.
- Several ROIs: drawn, detected or loaded from
roiMask/roiMasks; each has a name, colour and area. - Optional B&W 256 levels, Gaussian smoothing (sigma 2 px) and per-frame normalisation to 0–1 (not for Brightness or ΔF/F), applied in that order.
Walkthrough on the demo stacks
Checks
After every Run, one row per check (they never change the results): The Checks tab sits next to Result and Motion correction; click a row for why it matters and what to try, and the status bar says when there are warnings.
- Motion: how far the frames move from their usual position (the largest distance, estimated on up to 100 evenly spaced frames when motion correction is off) against the size of the smallest ROI (the width of a disk of the same area). Check above 20% of it (and 1 px), Warning from half of it: the cell slides out of its ROI, which then measures its neighbours and the background, and the movement itself makes false rises and dips. With Motion correction the same rules apply to the movement left after it, and a Check says when frames had moved by more than a whole ROI (a rigid correction cannot follow tissue that bends or moves in depth). Line methods: a Check above 2 px.
- Bleaching (Brightness, Both and ΔF/F): each ROI's baseline (20th percentile of the first and of the last tenth of the frames) at the end against the start. Check above 10%, Warning above 25% darker: ΔF/F divides by F0 from the first frames, so it drifts below 0 and late responses look smaller. A Check also when it gets more than 10% brighter (focus or light drift).
- Saturation: ROI pixels at the top value of the stack, as loaded. Check above 0.1%, Warning above 1% of a ROI's pixels over all frames (the ROIs above 0.1% are named): clipped peaks are cut flat, so ΔF/F and brightness changes are underestimated. The top value counts as clipping when it is a camera's ceiling (255, 4095, 65535) or when values pile up there; otherwise it is just the brightest value.
- Preprocessing: Normalize each frame with Brightness or ΔF/F is a Check (it removes changes of the whole frame's brightness).
The checks are saved in the session, listed on the PDF report and summed up in the methods text.
Inputs and outputs
In
.matwithstackorframes(H × W × N grayscale or H × W × 3 × N RGB; otherwise the first variable is used)- Optional in the .mat:
timeVecort(one time per frame),roiMask(logical H × W) orroiMasks(H × W × K, optionalroiNames), used as the first ROIs - Multi-frame TIFF: RGB frames are converted to grayscale (mean of the colour channels). The frame interval, pixel size and channels are read from ImageJ, OME-TIFF and ScanImage files (one channel and the first slice are used); otherwise time = frame index
- Video (
.avi,.mp4): grey frames and the frame rate of the file - Files saved by microscope software in its own layout are not read: export the recording as a multi-frame TIFF (or a video) with that software first
Out
- .csv:
Time_splus one column per measure and ROI (<measure>_<ROI name>, e.g.DFF_Cell_1; measures Intensity, Movement, DFF), orDiameter_px(+Diameter_standard_px,Replacedwhen robust); for a kymograph, a matrix (first row = time) - .mat: struct
resultswith the series (one row per ROI),roiMasks/roiNames,roiMask(ROI 1),lineStart/lineEnd,motionCorrectionandshifts, and the preprocessing and diameter settings
Demo expectations
The two demo stacks are described on the demo data page. Expected results (from the in-app Help):
- Data:
demo_imaging.mat, 96 × 96 px, 150 frames at 10 Hz (15 s). A dark vertical vessel at x = 60 whose diameter oscillates 12 ± 3 px (9–15 px) every 5 s; a bright red blood cell moving down 2 px/frame (20 px/s); a cell at (24, 30), radius 6 px with calcium transients (ΔF/F ≈ 1) at 3, 7 and 11 s. The cell'sroiMaskis in the file. - The demo selects ΔF/F with that mask (baseline = first 30 frames) and a line across the vessel from (45, 70) to (75, 70).
- ΔF/F: flat ~0 until 3 s, then three peaks of ~0.2–0.3 at 3, 7 and 11 s, each decaying in ~1–2 s. (The simulated calcium signal has ΔF/F ≈ 1, but it is added on top of the tissue background inside the ROI, so the measured ΔF/F of the ROI is smaller.)
- Vessel diameter (same line): a sine between ~9 and ~15 px with a 5 s period. Kymograph along the vessel (e.g. from (60, 5) to (60, 90)): slanted streaks with a slope of 2 px per frame.
- Advanced demo (Try advanced demo (motion, 3 cells)): 96 × 96 px, 150 frames at 10 Hz. Every frame is shifted by up to ±3 px (smooth random walk); three cells: cell 1 at (22, 24) with events at 4, 8.5, 13 s, cell 2 at (26, 78) at 5.5, 10.5 s, cell 3 at (82, 30) at 7, 12 s; the vessel at x = 60 (12 ± 3 px, period 5 s) and a bright red blood cell that crosses the diameter line (35, 64)–(85, 64) about every 3 s.
- Motion correction: the Motion correction tab shows dy and dx following the dashed true shifts (error < 0.3 px), max shift ≈ 3 px.
- Show → Correlation image: the three cells are bright disks (correlation ≈ 0.9), the vessel a bright band; Detect cells adds exactly Cell 1–3 (the vessel is rejected as too elongated).
- ΔF/F (Run): three traces, each peaking only at its own cell's event times.
- Vessel diameter: without Robust diameter the trace jumps to ~50 px whenever the blood cell crosses the line; with Robust diameter it follows the 9–15 px sine (error < 2.5 px) and the replaced frames are circled.
- Checks (demo, ΔF/F): no warnings and nothing to check. Motion OK (the frames move by about 0.1 px; the ROI is 12 px across), Bleaching OK (the baseline changes by about 1%), Saturation OK (no ROI pixel clipped).
- Faults demo: load
demo_imaging_faults.matfrom the demo folder with Load stack (its three ROIs, Cell 1–3, come with it), choose ΔF/F (baseline 30 frames) and click Run. The Checks tab gives 3 warnings: Motion (the frames move by up to about 7 px from their usual place, about 70% of a 10 px cell, and motion correction is off), Bleaching (the baseline is about 30% darker at the end than at the start) and Saturation (about 2% of Cell 2's pixels over the recording are at 4095, the top of a 12-bit camera). Tick Motion correction and Run again: Motion becomes OK (frames moved by up to 7 px and were shifted back); bleaching and clipping stay, because they are in the light the camera recorded.
Step-by-step instructions and troubleshooting: ROI Analysis in the guide.
Histology and culture images
The Histology / culture window (launcher → Imaging) is for still images of fixed sections or cultures: one or more images (sections, time points, wells), each with a nuclear channel and one or more marker channels.
What it does
- Load TIFF (every page is a channel), PNG / JPG (the colours are channels) or .mat. The pixel size is read from ImageJ (also µm), OME-TIFF, Aperio .svs or the TIFF resolution tags, otherwise typed; sizes are given in µm² and densities per mm². Multi-channel TIFFs from microscope software open on one channel and the first slice.
- Align (optional): the channels onto channel 1 (the colour shift of many microscopes), and images 2, 3 … onto image 1, either by an automatic shift (the same field imaged again) or by landmarks clicked in both images (serial sections: shift, rotation, scaling and shear).
- Count cells in the nuclear channel: background subtraction (uneven illumination), an automatic threshold (Otsu's method[24], never below 3 noise SD), touching cells split at their narrow waist, and size and shape limits that leave out debris and fibres.
- Markers: a cell is positive when enough of it (default 50%) is bright in the marker channel.
- Regions: polygons clicked on the image give counts, % positive and cells per mm² per region. Import regions… adds regions drawn in ImageJ / Fiji (a
.roi, or the ROI Manager'sRoiSet.zip: polygon, freehand, traced, rectangle and oval, with their names) or QuPath (annotations exported as GeoJSON, Polygon and MultiPolygon, with their names or classifications), in the pixels of image 1; lines and points are skipped. - A Checks tab says in plain words where the pixel size came from, how well the alignment worked, which threshold was used and what was not counted: one row per check (OK, Check or Warning), and a click on a row shows why it matters and what to try.
Demo expectations
- Data:
demo_histology.mat(or Try demo data): two images of the same culture field, Culture, day 1 and Culture, day 3, 400 × 400 px at 1 µm per pixel (0.16 mm²). Channel 1 Nuclei (DAPI), channel 2 Marker (GFP). - 60 nuclei in each image (48 single and 6 touching pairs): 30 in the left half and 30 in the right half. Count cells should give 60 in both images (375 cells per mm²); the pairs are split into two cells each.
- Marker-positive: 24 of 60 on day 1 and 39 of 60 on day 3 (every day-1 positive cell stays positive).
- Not counted: 20 small specks of debris (under 15 µm², removed by Min size) and 1 long fibre (removed by Max elongation). Uneven illumination is removed by the background step.
- Alignment: day 3 was imaged after the dish went back on the stage, shifted by 6.4 px down and 9.2 px left ([dy dx] = [6.4 −9.2]); Shift (automatic) recovers it to about 0.2 px. The marker channel is shifted by [1 2] px from the nuclei in both images (Align channels corrects it).
- Regions: add Region A = left half (x ≤ 200.5) and Region B = right half: 30 cells each (375 per mm², 0.08 mm² each). Marker-positive per region: 12 and 12 on day 1, 18 and 21 on day 3 (after aligning). Without aligning, the Checks tab has a Warning row, Alignment: the regions cover different tissue in the two images (what to try: align them in step 2).
- Checks tab (aligned, default settings): pixel size read from the file; image 2 moved by about 9.2 px right and 6.4 px up; the marker channel was about 2.6 px off (corrected; listed as a row to check, so look at the composite: markers should sit on their nuclei); 20 small objects and 1 elongated object not counted; 6 extra cells found by splitting the touching pairs. Click the Channels row: "What to try: Check the composite: markers should sit on their nuclei."
Walkthrough on the demo culture
Step-by-step instructions and troubleshooting: Histology / culture in the guide.